QtCreator is brilliant, I just wish the Qt company would stop trying to hide it away! It's getting harder and harder to find the download link on their website.
Interesting. When I investigated it a few months ago I was frustrated that I could only find docs for QtCreator, and nothing about just dropping in headers and writing code.
If you use the Dilbert comic for training data, I suppose you could get pretty far.
In fact, turns out Scott Adams wrote a post on the topic: [1]
> ... My prediction that robots will dominate management before they dominate blue collar jobs is based on The Dilbert Principle which observes that the least skilled employees are promoted to management. You need your most skilled people doing interface design, engineering, and the hard stuff. Management is mostly about optimizing resource allocation, and that is something a robot can learn relatively easily, at least compared to most skilled jobs.
> You might wonder if a robot can have enough leadership qualities to be a manager. I would point out that most humans in management have zero leadership skills, so the bar isn’t set high ...
Gosh there are a lot of these programs, aren't there?
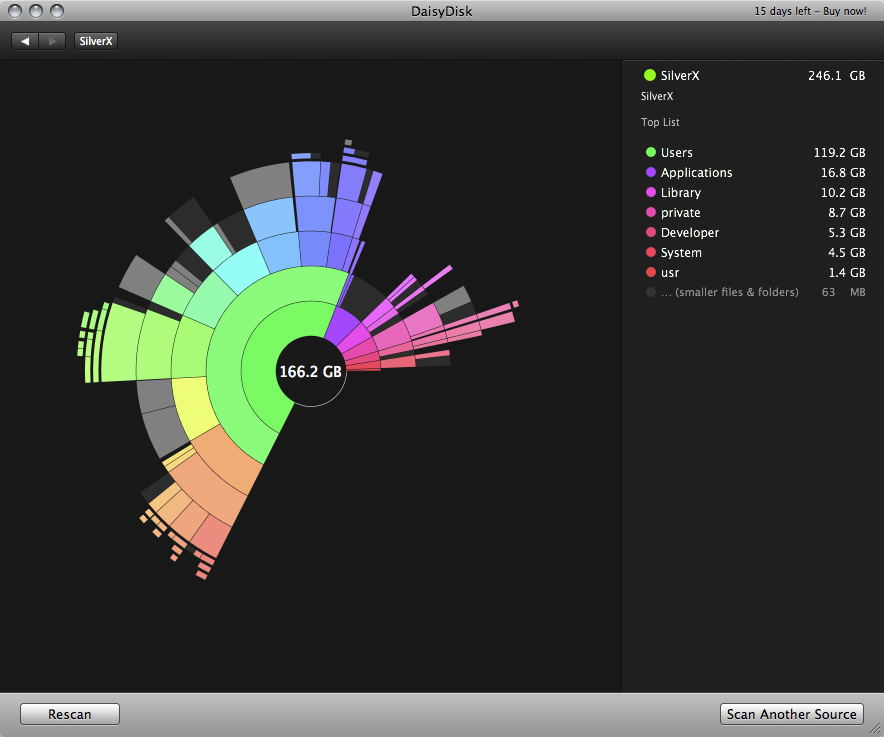
For some reason I find it really hard to read these tree map visualisations. I know the theory and all that, but for me they just aren't an intuitive way of displaying that kind of information. For me a radial graph (i.e. pie chart like) is much easier to grok - I don't even have to think about it, I just get it. Seems like there must be plenty of people who don't think the same way though, given how many different tree map disk viewers there are out there!
I've used treemaps for many years, to reduce disk space, and have been somewhat enamored of them.
Then earlier this year, I happened to use flame graphs for visualizing profiling data.
This is when I realized I hadn't quite understood flame graphs. It became obvious that you can use flame graphs for visualizing the SPACE used by a tree hierarchy as well as TIME.
I googled and Brendan Gregg already wrote about this!
So from now on, I believe I will use flame graphs instead of treemaps to visualize this space.
-----
Details: A common point of confusion for flame graphs is that the Y axis is "time elapsed". (Chrome dev tools has a "flame chart" where the Y axis is time elapsed, but it's not a flame graph.)
The Y axis is "cumulative time used", and the X axis is the call stack. Combining call stacks sampled at different times gives you a TREE, because a given function calls multiple functions.
So if that's clear, it should be clear why flame graphs can be used instead of treemaps. They are the same visualization! And flame graphs have the benefit that they use a one spatial dimension to represent quantity, rather than two. TreeMaps have the same problem as pie charts -- human perception isn't good at measuring areas.
Also, with treemaps, you have error due to the inability to represent a internal directory of zero size (you need some space for the label). Flame Graphs don't have this problem because directories are stacked on the Y axis.
There's a few reasons why rectangular shapes are superior... They fill the available space better than circles, and you can generally compare areas in rectangular shapes better than areas with curves. But, generally you're using these tools to spot outliers, in which case either approach works just fine.
You could try this Electron-based app SpaceRadar that should run on Windows, Mac, Linux https://github.com/zz85/space-radar
It has some support for sunburst graphs, flame charts, and treemaps (disclaimer, author here)
You can drill down in Diskitude by right clicking. I agree it's not as nice as Daisy Disk, but it's the best I've found for Windows (for my tastes) and you can't beat the price...
The problem with radial graphs is that files get visually larger if you move them to a directory deeper. They're fine for a single layer, but not hierarchical.
Interesting! What would you say makes it better than the others? I'm working on something similar but as-yet-unannounced and I'd love to know if we're tackling the right problems...
Maybe the effort just isn't where you're looking? Intel provides the Threading Building Blocks library for C++; some top notch debugging & profiling tools with multi-threading support; very good documentation; and they do quite a bit of community outreach to educate about and promote multi-threaded programming. (I'm not affiliated with them, just grateful for all of that stuff!)
Haskell is used for critical projects in production at Standard Chartered, Barclays and Facebook. There are also numerous startups. For both parallelism and concurrency, Haskell has a particularly good story. There's now even an O'Reilly book: "Parallel and Concurrent Programming in Haskell"
SIMD = Single Instruction Multiple Data, meaning the same instruction being applied to multiple different values simultaneously. That's exactly what GPUs do.
That's exactly what GPUs do in a single thread, but GPUs are also about threading, usually sporting tens, if not hundreds of small cores to effectively allow them to compute that many pixels (or rather shader outputs) in parallel. Otherwise, it wouldn't scale much.
That being said, I understand you only wanted to point out the error in the upper post.
The important difference is that not everything in Unreal is GC'd, only UObjects. Internally the rendering, animation, networking and other high-performance subsystems don't use GC because they can't afford the overhead. Being able to opt in to GC where it's useful is great, being forced to use it everywhere can be a hassle.
I really wish the Qt Company would stop bundling QtCreator as a required component of the Qt SDK.
I use QtCreator as my main IDE & think it's great, so of course I install new versions as soon as they become available. I compile & test against several different versions of Qt though and every single one of them lumbers me with an additional out-of-date copy of my IDE. This bugs me - more than it probably should.
> I have long wanted to see programmers experiment with taking this IDE thing much further. Almost every other authoring tool has an opaque file format, manipulated via one or more views. E.g. when a digital artist wants to create and manage a complex 3D scene, they use a tool like Maya. They're not fussed about whether they can read the file format!
Interesting choice of example, because over the last few years open formats like Pixar's USD (https://graphics.pixar.com/usd/docs/index.html) have been emerging for managing complex 3D scenes - precisely because of problems with opaque file formats.
That said, we're now seeing more and more things like Unreal Engine's Blueprints, Apple's "Swift Playgrounds" and so on. I think your wish is slowly coming true.